.
At a glance
Counting how many distinct elements are in a large dataset is surprisingly difficult problem. As the dataset grows bigger, the amount of memory and computation required to count the distinct elements in it grows considerably.
A common example of this is, “How many unique visitors to my website did I get today?” Note how we want unique, distinct visitors. We cannot simply have a counter that goes up by one with each page-view and call it a day.
Surely you can just keep a list of every IP address that visits, and tally up at the end of the day? Well, you can, but if you’re receiving hundreds of millions of visitors a day, you’re going to run out of space to store all those IPs at some point.
HyperLogLog is an algorithm that lets us make a good guess at counting huge numbers of distinct elements, with very little computation or memory required. It’s fast and it’s lightweight — but that comes with the cost of an imperfect result. Usually this means the result is no more than 2% away from the actual answer, which may be acceptable for your situation. For example, Reddit uses HyperLogLog to store view counts on posts.
In this post, I’m going to explain the core idea and motivation for HyperLogLog, but I’m not going to get into the nitty gritty maths. I want you to get an intuition for what it’s trying to achieve. As a result, some maths in this article has been grossly simplified to make a point. I’ve left footnotes to clear some of these up.
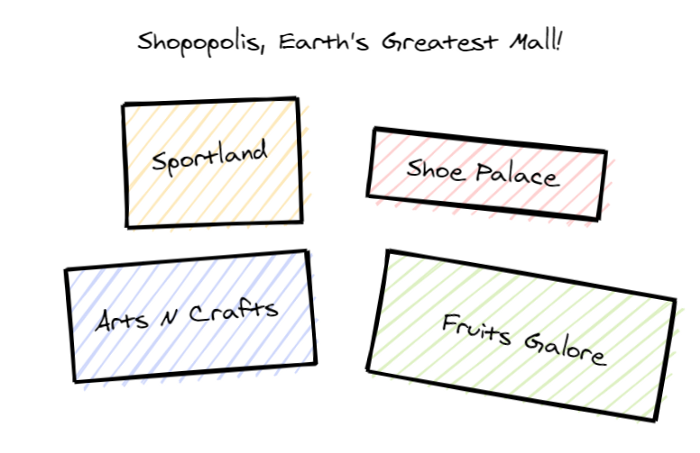
Let’s say you run a large high-end shopping mall, Shopopolis, with millions of visitors a year. It’s important that you know how many unique paying customers you have on any given day, as this will help you forecast revenue and costs. This is a difficult problem to solve. You can’t just count the number of people coming in and out of doors, as not all of them will buy something, and some will come in and out multiple times during the day. There are a few techniques that you could use, but here we’ll focus on one that would make use of HyperLogLog. We’ll start far simpler question.
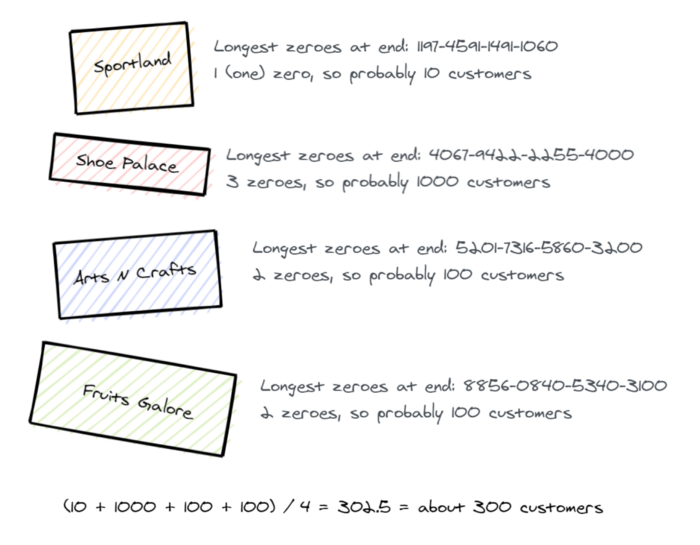
On a given Tuesday, how many unique paying customers were there in our most decadent shop, Sportland?
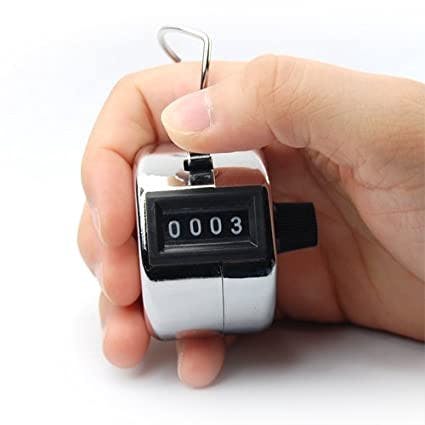
We can give every cashier a click counter, which they reset to zero at the start of the day. Every time a purchase is made, the cashier clicks the counter. By the end of the day, we can add up the counters and know exactly how many unique paying customers we had!
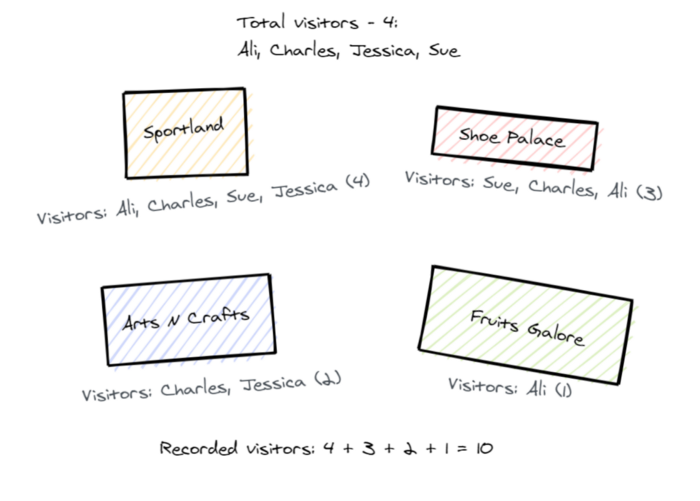
Except, a customer may have come back several times for more items, possibly at different tills to a new cashier. Since this is such a rare occurrence though, it’s not a problem in practise. We don’t care if our counter is off by one or two, especially if we’ve had hundreds of customers.
If we extrapolate this to the entire mall though, we’ll quickly run into problems. Sportland might report 400 customers, where Shoe Palace reports 300 customers. Added together that’s 700 customers — but what if 200 people went to both Sportland and Shoe Palace? In this case, we need to adjust to 400+300−200=500 customers! We said above that being off by 1 or 2 is fine — when it’s that small an error margin, does it matter? But here we’ve overestimated by 20%! This is unacceptable.
This problem will only get worse as we bring more shops into the equation. If someone has come to our shopping mall, it’s likely they’ll shop at multiple stores, so we cannot use this particular counting technique.
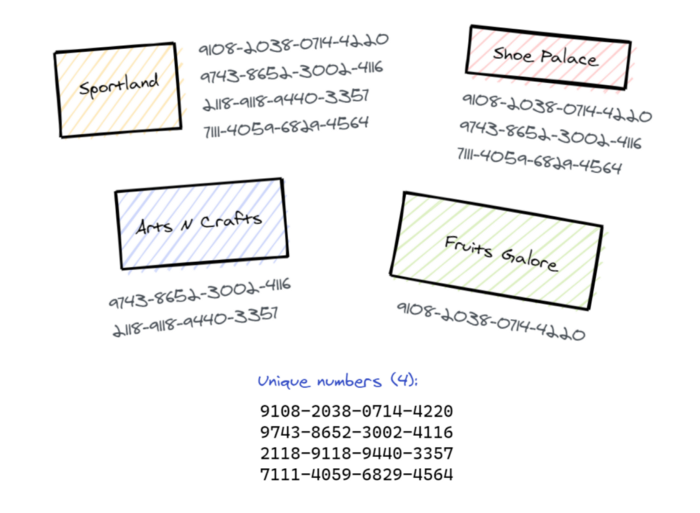
We need a way to uniquely identify every customer, and only count them once across all stores. Luckily, we can already do this, by writing down their credit card number when they pay. (For hygiene reasons, Shopopolis doesn’t accept cash.)
We’re going to make the assumption that all 16 numbers on a card are completely random and uniformly distributed.
We’re going to take away every cashiers’ click counter, and give them a clipboard. From now on, every time a purchase is made, they’ll write down the credit card number used onto the clipboard. At this point, we don’t care whether the card has appeared before —if they’re not sure, they’ll just put it on anyway.
At the end of the day, some poor soul who we’ll call Jimm will collect all of the paper off the clipboards and turn them into a giant stack of paper. Jimm will go through this stack making a new list of credit card numbers, but this time being careful to only add it once to the list. If this means they have to search the whole list each time they add a new card number, so be it. Once they’ve got through the stack, they count up the number of items in the list, and that’s the number of unique paying customers!
It will be accurate (hopefully!), but it will be very slow for the assigned counter at the end. It will also require a lot of paper — both for the counter, and for each of the cashiers. It’s possible that while some quiet shops will only need one sheet of paper to store all the card numbers, the larger ones will need piles and piles of paper!
Let’s introduce HyperLogLog’s key secret: probabilities.
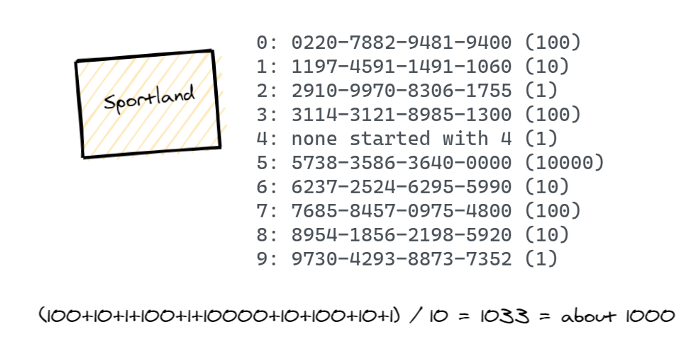
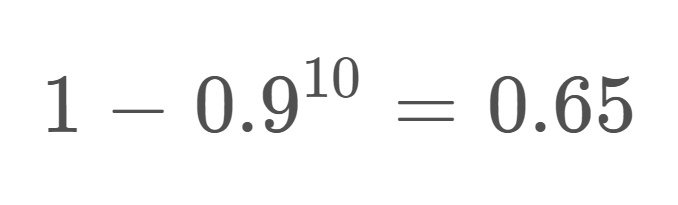
If a credit card’s number is random, what are the chances that the final digit is a 0? The digit could be 0, 1, 2, 3, 4, 5, 6, 7, 8 or 9 — there are 10 possible choices, meaning that there’s a 1 in 10 chance that it is 0. We can reason from this that if a card number ends in 0, we’ve probably seen at least 10 people overall. [1]
Let’s go a step further: what are the chances the number ends in 00? This is the same problem as above, except we go from 00 to 99. As such, there’s a 1 in 100 chance of a card ending in 00. This means is we see a card ending in 00, we’ve probably seen about 100 customers!
Using this knowledge, we can simplify the cashiers’ lives considerably. Instead of giving them reams of paper on a clipboard, we’ll give them a mini whiteboard. When a purchase is made, they look at the end of the card number. If the total number of zeroes at the end is larger than what they have written on the whiteboard, they update the whiteboard with the new number of zeroes.
At the end of the day, our previously mentioned Jimm adds all of these estimates up, and divides it by the number of whiteboards. This average is now our estimate for unique paying customers. [2]
Notice how it required very little work from the cashiers and Jimm. Now though, we have a probabilistic answer. We traded accuracy for memory and speed.
What if a very quiet shop with only 1 customer all day, happens to get a card ending 00000, throwing the estimates out of whack?
Here we can use a technique called bucketing to smooth out outliers like this. We make 10 “buckets”, one for each possible starting digit of a card number.
This increased the amount of memory we’re using — each cashier now has to store 10 cards instead of 1 — but it’s still far smaller than the total amount of card numbers they would have previously needed to store. Jimm will receive all of the buckets to merge himself, rather than a single estimate from each shop.
Not only does bucketing give us a smoother answer, it lets us improve our result in a sneaky way.
Outliers (like the card with 5 zeroes at the end) can wreak havoc on our estimations. Once we’ve brought all the buckets together, but before we get our mean, Jimm will throw away the largest 30% of estimates. This has been proven to increase the accuracy by around 25%! [3]
In real cases of HyperLogLog, we’re not going to be storing credit card numbers. Rather we might be working with an IP address, a random string, or even a real name. These will not be randomly distributed numbers. Instead, we will take these unique IDs, and run them through a hashing function which will turn something like “Jimm Smith” into 0101100101010100.
By using binary (base 2) instead of denary (base 10, what credit card numbers use), our accuracy actually improves yet again, as the problem mentioned in footnote #1 no longer applies.
Thanks to HyperLogLog, our cashiers are able to easily store an estimate for how many unique customers they had in a given day. By combining these results, Shopopolis is able to make quick and accurate estimates for use in future planning.
HyperLogLog lets us count huge numbers of distinct elements, in a very accurate (though still imperfect) manner, with very little memory or CPU usage. It’s well suited to being distributed across many places as well, as seen with the multiple shops.
Hopefully this article has given you insight into the idea behind HyperLogLog — perhaps you want to go implement a version of it yourself! I’ve left links for further reading below.
This isn’t quite true. In actuality, seeing 10 unique cards only gives us a 65% chance of having seen a 0 at the end. This problem goes away when using binary (base 2) instead of base 10.
Here we’ve used the arithmetic mean, or “average” of the values. Real HyperLogLog uses a different technique, called the harmonic mean, instead. This gives a very different, and much more accurate answer.
“Specifically, by throwing out the 30% of buckets with the largest values, and averaging only 70% of buckets with the smaller values, accuracy can be improved from 1.30/sqrt(m) to only 1.05/sqrt(m)!” I won’t personally pretend to understand why this is, but you can learn more and look at the maths behind it at
notdot.net
.
The following articles and videos were invaluable to my research for this post, and I recommend following up with them if you want to learn more.